10 minutes
Spycam
A writeup for challenge 10 of the beginners quests of the Google CTF.
Story line
New York - Office Complex
New York is hot, and you are on your way to the office complex. It seems like it is well guarded, even though you are expected under the alias of the assassin, perhaps it will be a better idea to sneak inside the building, unseen? You climb through a window on the side of the building. Inside you spot more guards, quick, hide behind a desk. Now you have to sneak past the guards into the main office.
Challenge: Spycam (hardware)
You manage to find some exposed wires and quickly hook them up to your portable terminal. It seems to be a live feed of the internal CCTV system. If you can manage to decode the signal you might find something interesting, maybe a code or a password to get past the locked door.
After solving
Congratulations, you successfully sneaked past the guards, and now you are inside the main office. Look over there, a safe case! Wait, what, it is open, no way! It’s only a photo inside, what a disappointment… But wait, don’t get hasty now, it seems like it’s a harbor in the picture, and there is something scribbled on the back, it’s coordinates to the harbor which seems to be located in Singapore.
Attachment
Recon
The attachment contains one file: chall.tar.gz.
Extracting this file gives seven csv files of about 25MB:
- 1.csv
- 2.csv
- 3.csv
- 4.csv
- 5.csv
- 6.csv
- 7.csv
They all contain 600255 lines.
A sample of the first csv file:
-0.0018051198211097765 ,4.25 ,-0.05 ,-0.05 ,-0.18
-0.001805079821043734  ,4.25 ,-0.05 ,-0.08 ,-0.18
-0.0018050398209776917 ,4.3  ,-0.05 ,-0.08 ,-0.18
-0.0018049998209116493 ,4.3  ,-0.05 ,-0.08 ,-0.18
-0.0018049598208456068 ,4.25 ,-0.05 ,-0.08 ,-0.2
-0.0018049198207795644 ,4.25 ,-0.05 ,-0.05 ,-0.18
-0.001804879820713522  ,4.25 ,-0.05 ,-0.05 ,-0.18
Solving
I found this challenge to be pretty difficult as it gives us very little information to start with.
The description says something about CCTV footage, so these CSVs probably contains some kind of image or video. I don’t know any format though that looks like this.
The first column in the CSV file seems to only be incrementing. This could be a timing signal for something like VGA. I though of this because Ben Eater makes great videos about how computers work and made a video about creating a graphics card. I recommend you go watch it if you don’t know how VGA works. I also remmend you to watch this follow-up video about RGB in VGA.
With my basic understanding about VGA, I tried to make sense of the data.
As I said, the first column seems to be the timing, but the others are still unclear. I continued by taking a look at the value range of the columns using a Python script.
filename = "1.csv"

with open(filename, "r") as file:
    min_max = [[float(value), float(value)]
               for value in file.readline().split(",")]

    for line in file:
        for index, value in enumerate(map(float, line.split(","))):
            min_max[index][0] = min(min_max[index][0], value)
            min_max[index][1] = max(min_max[index][1], value)


for index, [low, high] in enumerate(min_max):
    print(f"#index: {index}")
    print(f"{low=}")
    print(f"{high=}")
    print(f"rng={high-low}")
    print()
#index: 0
low=-0.0018051198211097765
high=0.022205119821109773
rng=0.02401023964221955

#index: 1
low=-0.35
high=4.8
rng=5.1499999999999995

#index: 2
low=-0.4
high=0.28
rng=0.68

#index: 3
low=-0.38
high=0.28
rng=0.66

#index: 4
low=-0.43
high=0.15
rng=0.58
The output shows the ranges of the last three indexes are about the same. This hints at color values, and, if you know VGA, this makes sense as the value would be between 0 and 0.7 volts.
In today’s images, the range is defined in a byte with a value between 0 and 255. So later these numbers will have to multiplied by 255/0.7.
The purpose of the second column is, however, still unclear. From the range I could see it goes from 0 to 5 and from scrolling through the CSV file I could see it only turned to 0 twice. To confirm this, I wrote the following script:
filename = "1.csv"

x_values = set()

with open(filename, "r") as file:
    for index, line in enumerate(file):
        _, x, _, _, _ = map(float, line.split(","))

        x_values.add(x)

        # Only print every 1000 lines as the output would be too cluttered otherwise
        if index % 1000 == 0 and round(x) == 0:
            print(f"{index=}, {x=}")

print(f"{x_values=}")
Which returns the following output:
index=44000, x=0.4
index=45000, x=0.4
index=461000, x=0.4
index=462000, x=0.4
x_values={-0.35, 0.45, 0.4, 0.35, 4.2, 4.25, 4.3, 4.35, 4.8, 4.15, -0.25}
The output shows it’s a HIGH LOW signal which is probably used as a sync signal to tell the screen when to start and stop reading.
To only get the part we need, I wrote the following script:
import glob

for filename in glob.glob("*.csv"):
    should_read = False

    previous_was_zero = False
    line_offset = 0

    timing_offset = 0

    counter = 0

    with open(filename, "r") as file:
        for line in file:
            timing, sync, r, g, b = map(float, line.split(","))

            if sync > 3:
                if previous_was_zero:
                    should_read = True
                    timing_offset = timing
            elif should_read and not previous_was_zero:
                should_read = False
                break

            previous_was_zero = sync < 3
            line_offset += len(line)

            if should_read:
                counter += 1

    print(f"{counter=}, timing={(timing-timing_offset)*1e3}")
In this script I count the number of lines that I want to use and also printed the timings in (probably) milliseconds. I want these numbers so I can find out what the resolution of the VGA signal is.
The output was roughly the same for all seven files:
counter=415492, timing=16.619707440046454
counter=415492, timing=16.619707440046454
counter=415491, timing=16.61966743998041
counter=415491, timing=16.619667439980415
counter=415491, timing=16.619667439980415
counter=415491, timing=16.61966743998041
counter=415491, timing=16.619667439980415
This means the frame is about 415492 pixels in total and it takes 16.6 ms to draw it.
With this information I went to TinyVGA. This website contains the timings for all VGA resolutions. From it’s catalog, I found 640 x 480 @ 60 Hz to be the best match as it the total amount of pixels would be 800 * 525 = 420000, with a total frame time of 16.683217477656 ms.
This is pretty close to our values, so I tried to render a picture using it’s vertical refresh rate of 31.46875 kHz.
The script I used is the following:
import glob
from PIL import Image

width = 800 # amount of pixels in one line
height = 525 # amount of lines in whole frame
vertical_refresh = 31468.75 # vertical refresh rate in Hz

lowest_voltage = -0.4 # lowest voltage of a signal

for filename in glob.glob("*.csv"):
    img = Image.new("RGB", (width, height), (255, 255, 255))

    should_read = False

    previous_was_zero = False
    line_offset = 0

    timing_offset = 0

    with open(filename, "r") as file:
        for line in file:
            timing, sync, r, g, b = map(float, line.split(","))

            if sync > 3:
                if previous_was_zero:
                    should_read = True
                    timing_offset = timing
            elif should_read and not previous_was_zero:
                should_read = False
                break

            previous_was_zero = sync < 3
            line_offset += len(line)

            if should_read:
                timing -= timing_offset

                y = int(timing*vertical_refresh)
                x = int((timing*vertical_refresh-y)*width)

                if not (0 <= x < width and 0 <= y < height):
                    print(x, y)
                r = (r-lowest_voltage)*(255/0.7)
                g = (g-lowest_voltage)*(255/0.7)
                b = (b-lowest_voltage)*(255/0.7)
                img.putpixel((x, y), tuple(map(int, [r, g, b])))

    img.save(f"out/{filename}.png")
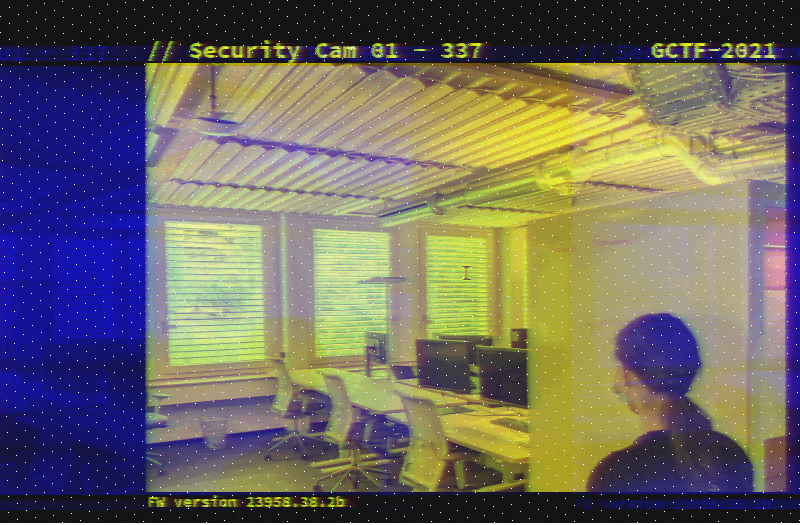
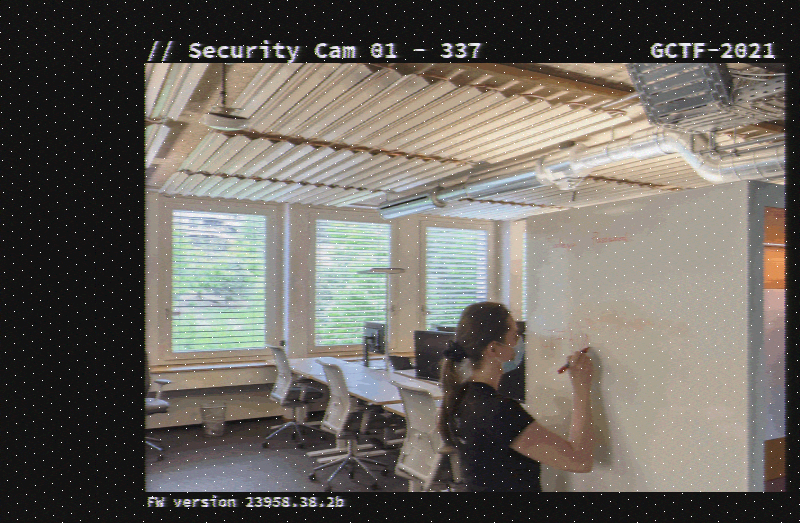
After running this script, I got the following images:
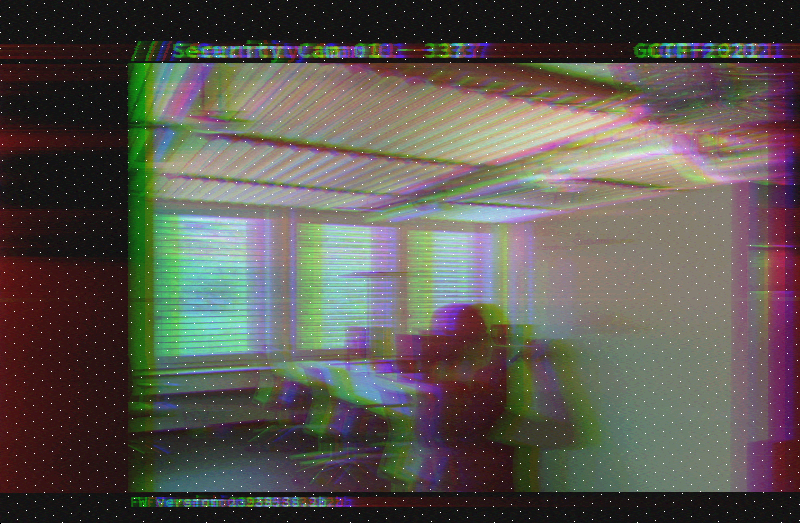
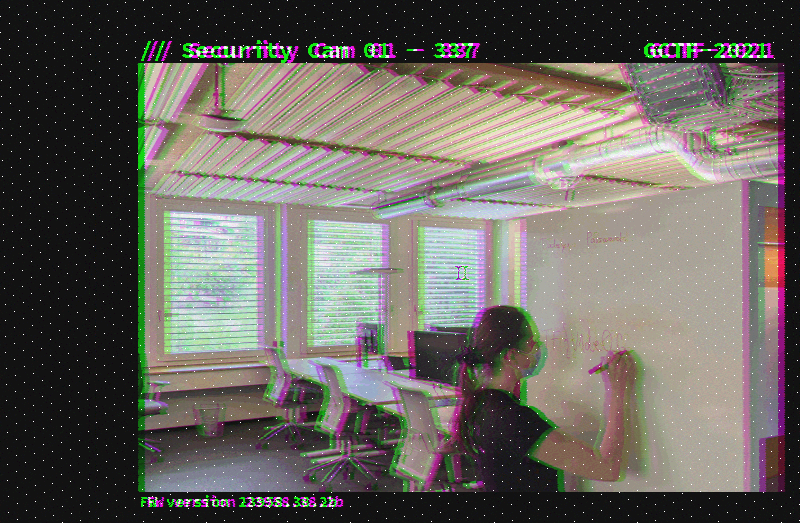
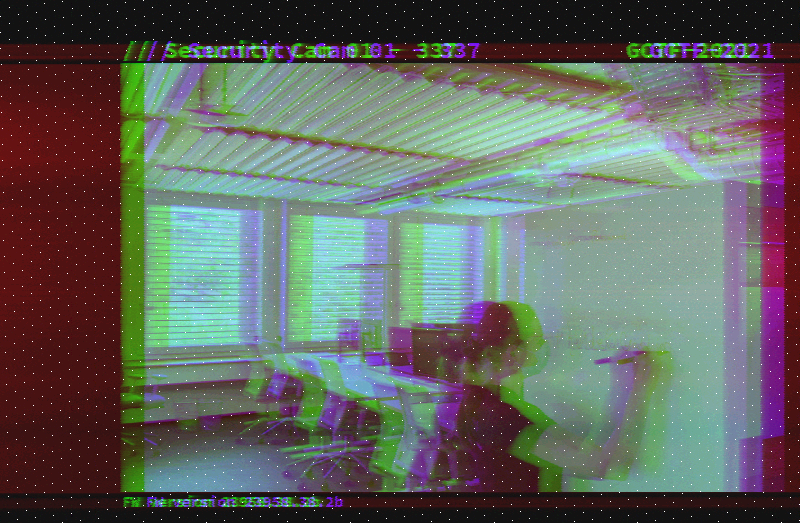
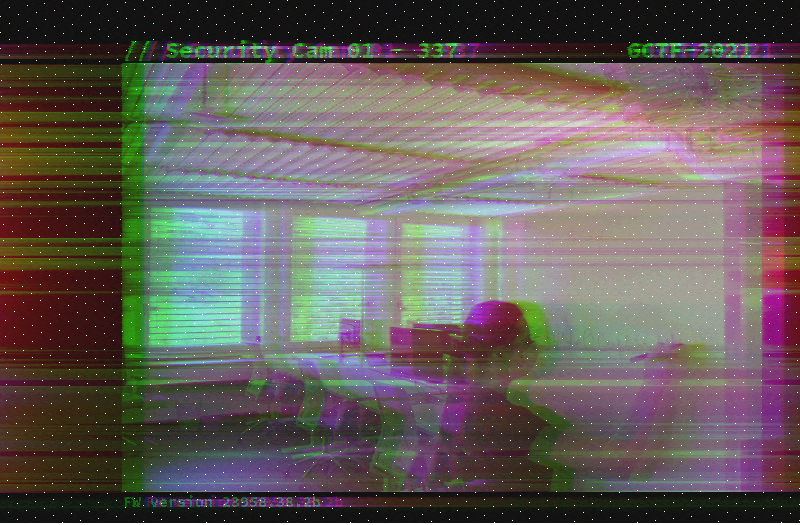
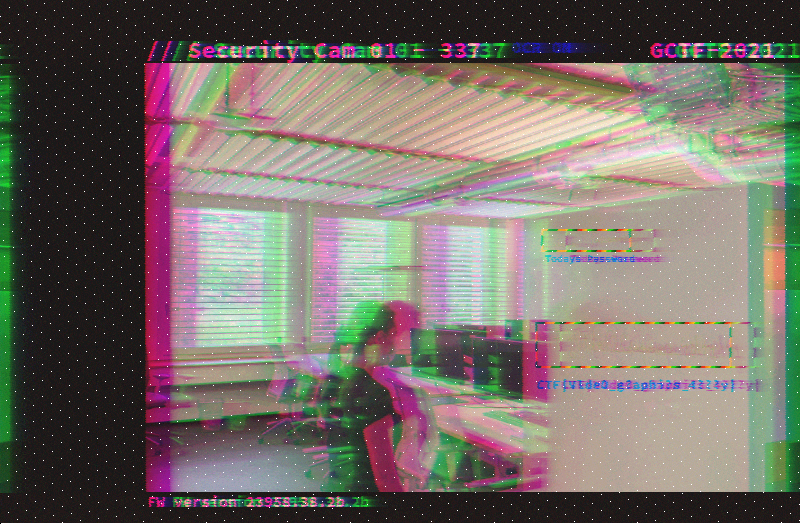
Upon looking at image number 7, I saw some text on the image. The RGB values are a little offset though which makes it unreadable.
I could have fixed it by manually moving the x and y around, but an easier fix is just only using one color. I did this by changing this line:
- img.putpixel((x, y), tuple(map(int, [r, g, b])))
+ img.putpixel((x, y), tuple(map(int, [r, r, r])))
This gave the following image:
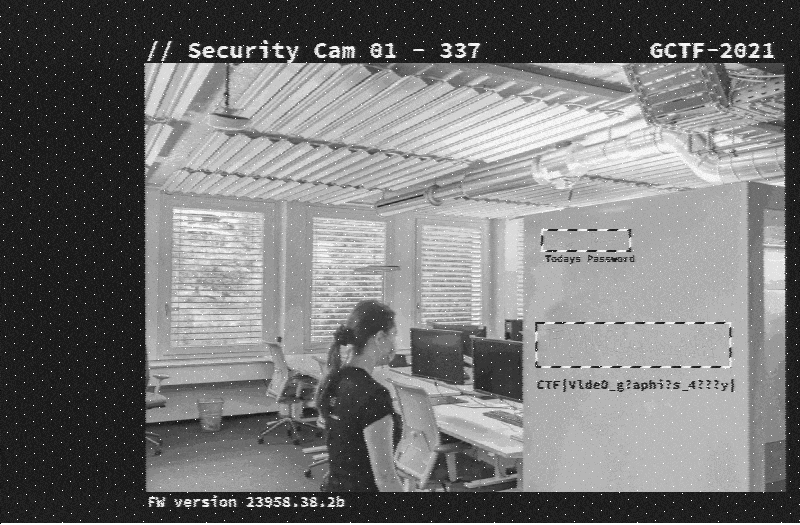
It looked like I got the flag, but when submitting CTF{vlde0_g?aphi?s_4???y} I got a message saying it was the wrong key.
It looks like the OCR failed, and the text is not readable in it’s current form. So I tried using only blue:
- img.putpixel((x, y), tuple(map(int, [r, g, b])))
+ img.putpixel((x, y), tuple(map(int, [b, b, b])))
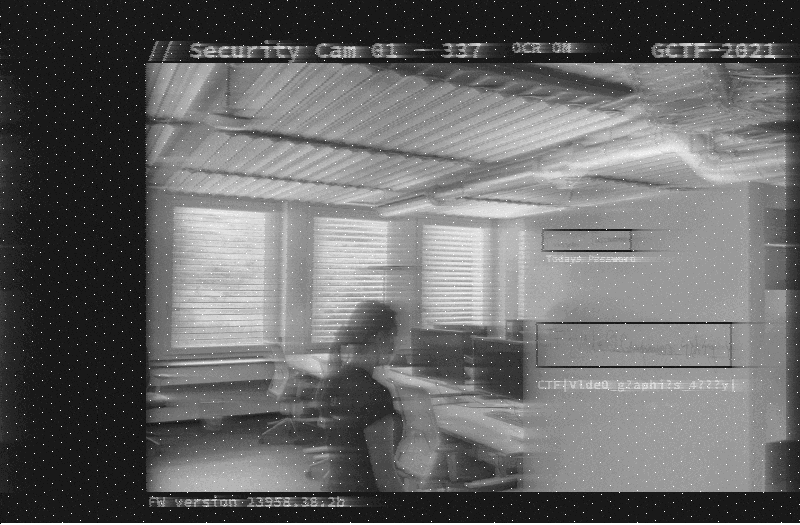
This is still pretty bad, but at least I can see something.
From the image I made the following changes:
- The “g” should be a capital “G”
- The last question mark should be a “4”
The other two were still unreadable, but from guessing I replaced the second question mark with a “c” and the other two that are left with an “r”.
Solution
The flag is correct! It’s CTF{V1de0_Graphics_4rr4y}.
Google CTFBeginners Questctfhackingwriteuphardware
1363 Words
Unknown
2021-11-07 11:41 +0000
fab68f7 @ 2025-01-05